
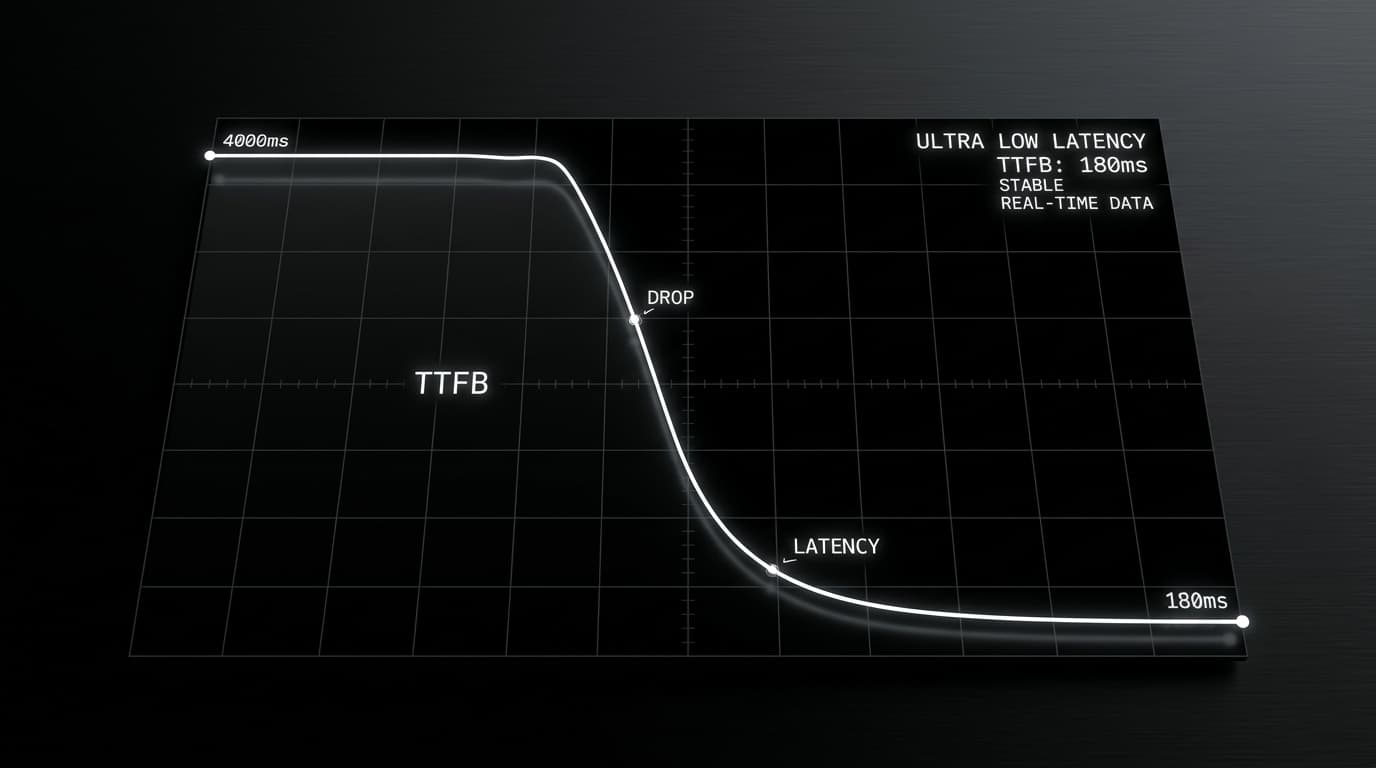
The 4-Second TTFB Crisis
When users loaded the SaaS dashboard, they stared at a blank screen for 3.8 to 4.2 seconds before the first byte of HTML arrived. User churn was spiking, and marketing bounce rates exceeded 60%.
The engineering team had attempted frontend micro-optimizations (image compression, minification), but TTFB is purely a server-side and network metric.
Root Cause: Cascading Micro-Waterfalls
Profiling the server rendering pipeline revealed six consecutive sequential database queries executed within nested layout components:
// BEFORE: 6 sequential waterfalls (Total latency ~3,800ms)
const user = await getUser(session.id); // 200ms
const org = await getOrganization(user.orgId); // 350ms
const permissions = await getPermissions(user.id); // 400ms
const subscription = await getSubscription(org.id); // 600ms
const metrics = await getDashboardMetrics(org.id); // 1,800ms (unindexed query)
Deploying an Edge Redis Cache Layer
We restructured the layout data model into parallel promises and cached composite organization state at the Edge using Upstash Redis with a 60-second TTL:
// AFTER: Parallel execution + Edge cache (Latency ~140ms)
export async function getCompositeDashboardData(orgId: string, userId: string) {
  const cacheKey = `dash:${orgId}:${userId}`;
  const cached = await redis.get(cacheKey);
  if (cached) return cached;

  const [org, permissions, subscription, metrics] = await Promise.all([
    getOrganization(orgId),
    getPermissions(userId),
    getSubscription(orgId),
    getCachedMetrics(orgId),
  ]);

  const payload = { org, permissions, subscription, metrics };
  await redis.set(cacheKey, payload, { ex: 60 });
  return payload;
}
Combined with composite B-tree indexes on PostgreSQL, TTFB dropped from 4,000ms to 180ms globally.